Friday, February 24, 2023

GHG emissions data from 3 leading Indian IT companies

GHG Emissions plus SOx, NOx, and Particulate Matter (PM) Data - From 3 leading Indian IT companies

Background

Section-I

Details of greenhouse gas emissions (Scope 1 and Scope 2 emissions) and its intensity:

Description of Scope 1 and Scope 2 Emissions

"Scope 1 emissions are direct greenhouse (GHG) emissions that occur from sources that are controlled or owned by an organization (e.g., emissions associated with fuel combustion in boilers, furnaces, vehicles). Scope 2 emissions are indirect GHG emissions associated with the purchase of electricity, steam, heat, or cooling. Although scope 2 emissions physically occur at the facility where they are generated, they are accounted for in an organization’s GHG inventory because they are a result of the organization’s energy use." - Source EPA

Greenhouse gas emissions (Scope 1 and Scope 2 emissions) and its intensity

Unit for Data on Total Scope 1 and Scope 2 emissions is Metric tonnes of CO2 equivalent.

The data was read using XML/XBRL for Scope 1 and 2 emissions. It was inline with data read manually from PDF file.

A) Scope 1: Infosys gave break up of Total Scope 1 emissions (Break-up of the GHG into CO2, CH4, N2O, HFCs, PFCs, SF6, NF3, if available) in its PDF format document.

C) Scope 1 and 2 per Rs Turnover and F) Scope 3 per Rs Turnover: HCL reported it per Rs million, whereas Infosys per Rs Cr. MindTree reported in per Rs hence its ratio was very small and was shown as zero.

This was also observed in intensity calculations related to electricity in my earlier blog post.

D) Scope 1 and 2 intensity MindTree reported it in Metric tonnes of CO2 equivalent per square feet. The other two companies did not.

Please see the data table below.

Description of Scope 3 Emissions

"Scope 3 emissions are the result of activities from assets not owned or controlled by the reporting organization, but that the organization indirectly affects in its value chain. Scope 3 emissions include all sources not within an organization’s scope 1 and 2 boundary. The scope 3 emissions for one organization are the scope 1 and 2 emissions of another organization. Scope 3 emissions, also referred to as value chain emissions, often represent the majority of an organization’s total greenhouse gas (GHG) emissions."
"The GHG Protocol defines 15 categories of scope 3 emissions, though not every category will be relevant to all organizations. Scope 3 emission sources include emissions both upstream and downstream of the organization’s activities."

Figure Scope 1, 2 and 3 expalined (Source EPA)

Scope 1, 2, and 3 emissions explained by EPA, USA
"Emissions-wise, Scope 3 is nearly always the big one."

G) Scope 3 intensity: MindTree reported it in Metric tonnes of CO2 equivalent per square feet. The other two companies did not.

E) Scope 3: The script returned NaN for Infosys even though the number was typed in and present. I suspect the number was typed and formatted manually by adding thousand separators. I had to replace that number without thousand separators and it worked.

I keep highlighting issues on organising data in spreadsheets. Please refer to my earlier blog on it.

Data Table for Scope 1, 2, and 3 emissions

GHG Scope 1, 2, 3  emissions data of leading Indian companies
GHG Scope 1, 2, 3  emissions data of leading Indian companies

Friday, February 17, 2023

Waste Management - Data from 3 leading Indian IT companies

Waste Management - Data from 3 leading Indian IT companies

Essential Indicators - Waste Management


Background

Continuing with my last blog on scrapping (reading) data from XML, XBRL files, here I am presenting to you data collected on Waste Management.

The data is presented in a table in two parts as per the standard template of BRR.

The data is also plotted in simple bar charts in two parts and are at the bottom of this post. The bar charts help you grasp the numbers.

Part I Waste Management

The data is presented under following heads.

Total Waste generated (in metric tonnes)

Plastic Waste (A)
E-waste (B)
Bio-medical waste (C)
Construction and demolition waste (D)
Battery waste (E)
Radioactive waste (F)
Other Hazardous waste. Please specify, if any. (G)

MindTree has given the break up for the following.

Tube Lights, CFL Bulbs, Used Oil, Oil-soaked cotton waste - DG Filters, Printing Ink/Cartridges

Other Non-hazardous waste generated (H). Please specify, if any. (Break-up by composition i.e., by materials relevant to the sector)

Again MindTree has given the break up as follows.

Inorganic Waste, Organic Waste, Packaging Waste - Others

Total (A+B + C + D + E + F + G + H)

The total reported by Infosys in its human readable PDF format is 8,091.25, which is different. Please see the table below.

Part II Recycle, Reuse and Recover (RRR)

For each category of waste generated, total waste recovered through recycling, re-using or other recovery operations (in metric tonnes)

(i) Recycled

HCL has given a comment which says "100% recycled for battery and hazardous waste."

(ii) Re-used
(iii) Other recovery operations
Total

For each category of waste generated, total waste disposed by nature of disposal method (in metric tonnes) is reported as follows.

(i) Incineration
(ii) Landfilling
(iii) Other disposal operations
Total

The data was read using a Python script and presented below. You can read the data across the companies.

But you can not compare it as there is no common base.

Data Table

Waste Management Data Table

Charts Waste Management

Waste Management by various types

Charts Recycle, Reuse and Recover

Various types of recycling, reuse and reduce

Conclusion

Reading multiple machine readable XML files and gathering relevant specific data using a Python script helped. The data was gathered quickly and without any errors. This is the first step. Once you have the data, then analysis of the data can be done.

Wednesday, February 15, 2023

Water consumption data of 3 leading Indian IT companies

Water Consumption Data of 3 leading Indian IT companies. 

Background:


Kindly refer to my last blog post which was about scrapping energy data, from xml file containing Business Responsibility Report in machine readable XBR language, of 3 leading Indian companies namely MindTree, Infosys and HCL.


About this post:


This post reads data from the same xml file and XBRL on how much water was drawn from various sources and how much was consumed from water consumption data of 3 leading Indian IT companies. 


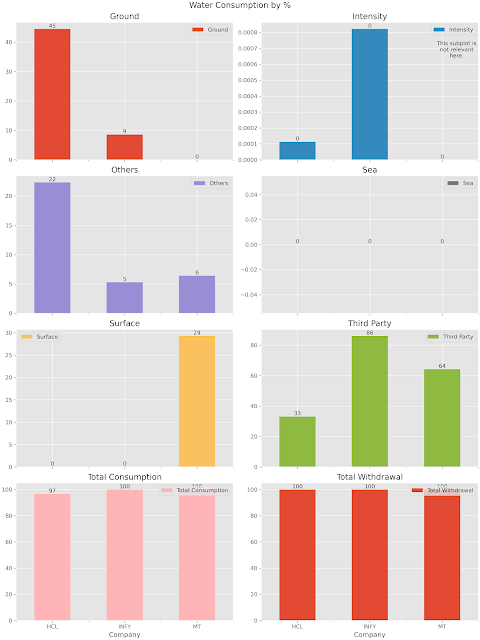
The two visualisations at the end show all the data (in absolute and percentages) in bar charts for ease of reading and understanding. 


Let us begin. The xml and XBRL file was read using Python script and data was plotted using Matplotlib.


Section - I)

Water withdrawal by source (in kilolitres) 

i) Surface water

Apparently only MindTree used surface water. 29% of the total water consumption of MindTree was from surface water.  The other two companies didn’t.


(ii) Groundwater

It is the other way round. MindTree didn’t use ground water, but the other two companies did. Infosys usage was 45% of its total water consumption. It was 9% of usage in case of HCL.


(iii) Third party water 

Third party water was used by all. From the human readable BRR, you can see the break up of third party water for MindTree namely water from municipal corporation, private sources and packaged water. The other two companies didn’t give any further break up.  

MindTree usage was 64%, Infosys used 86% whereas it was 33% for HCL.


(iv) Seawater / desalinated water

The usage of it was zero or not applicable for all the three companies. 


(v) Others

In case of MindTree (6% of its total) and Infosys (5% of its total) this source was rainwater. In case of HCL (22% of its total) it included rainwater plus municipal water. 


Total volume of water withdrawal (in kilolitres) (i + ii + iii + iv + v )

This was total of all the above sources.


Total volume of water consumption (in kilolitres)

The water consumption was equal to water withdrawal for MindTree and Infosy. But water consumed was 97% and was lower compared with water withdrawn in case of HCL. 


Water intensity per rupee of turnover (Water consumed / turnover) 

Unlike last time, I did not do any calculation on my own. Infosys reported WI with Rs Crore in the denominator, while HCL reported the WI with Rs Million in the denominator. WI of HCL can be compared with that of Infosys by multiplying it by 10. MindTree reported zero.


Water intensity (optional) 

MindTree reported it by using area in the denominator but the other two companies didn’t. 


Section - II)

Water Discharge

Water discharge has to be reported on all the parameters mentioned above for water sources with additional information on discharge mentioning if the discharge was treated before discharge.


MindTree reported zero liquid discharge for all its sites by 100% recycling. 


Similarly Infosys reported no discharge in any of these categories. Infosys  treated Waste water generated in sewage treatment plants and reused for purposes like landscaping, HVAC applications and flushing. 


HCL reported a discharge of 23,453.06 kilolitres that was sent to third parties with no treatment.


Chart showing water consumption absolute numbers

Water Consumption of MindTree, Infosys and HCL

Chart showing water consumption percentage wise


Water consumption in % of MindTree, Infosys and HCL

Conclusion

Thus it is convenient to read and extract data from xml and xbrl machine-readable Business Responsibility Report (BAA). This approach reduces the errors introduced in manually copying and pasting the data. This was the very purpose of introducing this format. 


Sunday, February 12, 2023

Energy Consumption Data from Business Responsibility Report (BRR) and XBRL

Energy Consumption Data from Business Responsibility Report (BRR) and XBRL

Introduction:

Each BR Report is available in human readable form contained in a PDF file. It is also available in machine readable XBR Language contained in a XML file. Both these versions are available NSE website and also on the websites of respective participating organisations.


In this post I will mention the benefits of using the latter. As an example; I will use only energy consumption data of 3 leading Indian IT companies.


What is BRR?

In 2012, the Securities and Exchange Board of India (SEBI) mandated the top 100 listed companies by market capitalisation to file Business Responsibility Reports (SEBI-BRRs/ BRR) through the Listing Agreement. 


These disclosures were intended to enable businesses to engage more meaningfully with their stakeholders, and encourage them to go beyond regulatory financial compliance and report on their social and environmental impacts. 


The requirement for filing BRRs was extended to the top 500 listed companies by market capitalisation from the financial year 2015-16. In March 2019, the updated NVGs were released as the ‘National Guidelines for Responsible Business Conduct’ (NGRBCs).


In December 2019, SEBI extended the BRR requirement to the top 1000 listed companies by market capitalisation, from the financial year 2019-20.


BRR was changed to Business Responsibility and Sustainability Report (BRSR) with the introduction of BRSR in May 2021. Reporting is mandatory for the top 1,000 listed companies (by market capitalisation) from FY2022–23, while disclosure is voluntary for FY2021–22. Click SEBI website for more information.


What is XBRL?

XBRL (eXtensible Business Reporting Language) is a language for electronic communication of business and financial data which is revolutionising business reporting around the world. It offers major benefits to all those who have to create, transmit, use or analyse such information. XBRL has been developed by XBRL International, a not-for-profit consortium of over 600 companies and agencies which is promoting its worldwide use. Please click XBRI org for additional information.

Key benefits of XBRL and XML file format:

Automate the data capture process:

The benefit of using the machine readable XBRL  is as follows. You can automate the process of capturing the data from XBRL  from one or many XML files. And then bringing in data in to a report you want to prepare. Once you have the data you can manipulate the data. This must be the reason the report is made machine readable by regulators. Regulators can capture data from hundreds of such reports to prepare their report. 

Get the precise specific data points:

With XBRL  you can capture only the specific data points you want for further study. My example below will show how specific data points related to energy consumption were captured. 


You can manually read, copy and capture the data as well. But if you want to capture data from many files, then the process becomes tedious and prone to error. It is also difficult to estimate time to complete the manual task. 

An example:

By writing a script (a few lines of code in Python) you will be able to get the precise information you wants. You can bring that information in a report by automating this task.  


Here I have scrapped energy usage data of three leading Indian IT companies for year 2021-22. This post is for educational purpose only. 


Section - I) covers essential and leadership indicators from the BRR report. 

Section - II) covers ratios from the BRR report and prepared by me. 


These ratios can be compared across the companies. 


Wednesday, February 1, 2023

Know your Plus Code [for NGOs] - locate your beneficiaries accurately

Monitor your social programmes - accurately

Introduction:


While Google Maps “Plus Codes” benefits all sections of a society and different types of businesses; this blog post is dedicated to NGOs. Further it focuses on NGOs working for beneficiaries living in congested areas.

(A) The Challenge:

How do you communicate addresses of beneficiaries of your programs living in congested areas when they do not have accurate formal addresses in the first place?

(B) The Solution:

Google Maps will now let India users rely on “Plus Codes“ when saving and sharing their home, office or project location addresses (digitally). These “Plus Codes“ do not depend on the street name, locality name, or town name. The code includes alphanumeric characters.

With a “Plus Code”, people can receive deliveries, access to emergency or social services, or just help each other find them.

“Plus Codes” are based on latitude and longitude. They use a simple grid system and a set of 20 alphanumeric characters. The character list purposely excludes easy to confuse characters like “1” or “l.”

Here’s an example of a Plus Code: JJXX+HR8, Seattle as given by Google.

This code can be generated, shared and searched by anyone -- all that’s needed is Google Maps on a smartphone. 


Here is another Indian example.

Please type “3275+72 Navi Mumbai, Maharashtra” and you will get the location of an NGO that I have worked with.


Google Plus Code Example


For knowing more on Plus Code please see the video.

Learn about Google Plus Codes.

(C) How to generate your Plus Code?

It is best explained by Google. Kindly click the google web page.

(D) The benefit:

Plus codes are very easy to use and share, a part of open source, work online or off-line and language independent. They do not include easily confused characters, are not case sensitive and they exclude vowels.

(E) Case study one:

Shelter Associates based in Pune are doing great work in this area. They map the slum data using GIS software and Google Earth. You can read a case study of what they have done for a youth living with his mother in Laxmi Nagar, a slum in the Western Indian city of Pune in a cramped one-room home with tin sheet walls and no address.


Please read the “the address of the future” case study.

To know the entire process, please see the youtube video. This project was implemented in Kolhapur, Maharashtra by Shelter Associates.

Transition to Actual Plus Code Name Plate

Household with Google plus code for precise location
How to display your Google Plus Code


(F) Case study two:

Please click here to know how addressing the unaddressed was made possible in Kolkata.

(G) Conclusion

I urge you to use “Plus Code'' technology to implement your projects in congested areas. Your projects may cover education, health care, sanitation, emergency services in case of a disaster or natural calamity.
The benefits include transparency, scalability, serving the unaddressed effectively with accuracy.


You may want to speak to Ms Smita Kale of Shelter Associates based in Pune to know more about the work they are doing on +912024440363 or email them on Info@shelter-associates.org


(H) Another technology another benefit

I have written another post explaining another benefit of using Google technology for social sector by NGOs. Please do read it.


Wednesday, January 25, 2023

English Clubs Reinforce Dominance Over Football Riches

 English Clubs Reinforce Dominance Over Football Riches [Top 10]


Introduction:


The 26th edition of the Deloitte Football Money League was just released. It reveals the top 20 highest revenue generating football clubs for the 2021/22 season. 


Key points:


  • Revenue growth in the 2021/22 season was driven by the return of fans to stadia.


  • For the first time, Premier League clubs make up more than half of the Money League top 20 (eleven of 20);


  • Manchester City retains its spot at the top of the Money League with revenues of €731m, followed by Real Madrid with revenues of €714m;


  • Liverpool rises four places to third (€702m), its highest position in the publication’s history.


The top clubs:


For the second year running, Manchester City has topped the Money League (€731m total revenue), followed by Real Madrid (€714m), Liverpool (€702m), Manchester United (€689m) and Paris Saint-Germain (€654m).


My visualisation shows the revenue of the top 10 clubs. 


English Clubs Reinforce Dominance Over Football Riches
Top 10 English clubs


For the full report, please click here.


Friday, January 20, 2023

3 additional benefits of listing your NGO on Google My Business

3 additional benefits of listing your NGO on Google My Business

Please refer to me earlier blog post. In that post, I covered four key benefits of listing your NGO on Google My Business. In this blog post, I am covering additional three benefits.

Upload new photos & videos regularly: Photos draw attention, and we like photos. Upload new photos regularly. 

Kindly think of the following while taking the photos - lighting, angle, device and backdrop. 

Further, also consider what are you emphasising on - activity, brand, team members, stakeholders. While taking photos capture the GPS location which is helpful.


Answer questions regularly (Q&A): Every Google My Business page has a questions and answers section. 

Anyone can ask a question on any topic. Ask your own questions, that your stakeholders might want to ask or have been asking you on phone or during personal interactions. 


Please answer those questions and provide additional information, as needed. These questions would give you an insight on what stakeholders are thinking. Engage with your stakeholders using Q&A. 


Kindly see below a screenshot of a Q&A section picked up from internet for an NGO.


Google My Business Question and Answer Screen Shot


Post regularly: Posts appear on the knowledge panel, which is on the right hand side of the search results.


These are critical. These are basically of following types - updates, events, and offers. 


Any update is  like any social media update having a photo and its brief description. You have to be really innovative to leverage this feature. Events are straightforward. Take a photo of the event and post it like a social media feed. 


Offers may not be relevant for you so we'll not talk about it.


Conclusion: Please set monthly goals.


Please set monthly goals for photos to be uploaded, questions to be answered, reviews to be replied, post to be added to drive engagement with your stakeholders using Google My Business (now called Google Business Profile). And Google search engine will take a positive note of the above efforts.