Showing posts with label CSR. Show all posts

Wednesday, March 1, 2023

CSR Data from from Business Responsibility Report

CSR data from Business Responsibility Report (BRR)

Background

CSR data was read from the BR reports in XML and XBRL formats for year 2021-22 using a Python script. The IT companies covered were MindTree, Infosys and HCL - all leaders in sustainability and CSR work.

CSR projects

MindTree provided information on all its projects. The information contained names of NGOs, brief description on projects and counts of beneficiaries. Some companies do not mention names of NGOs. The last column is count of beneficiaries.

MindTree CSR Projects

Company NGO Project Value
0 MT CURE India Clubfoot treatment for new-born Children 400
1 MT SPASTN Reaching inclusive educationand comprehensiverehabilitation to the doorstep 62
2 MT APD Reaching inclusive educationand comprehensiverehabilitation to the doorstep 178
3 MT AMBA Job-Oriented Training ofIntellectually Disabled Youthsfor Employment 200
4 MT Sparsh Foundation Early Corrective Surgeries 29
5 MT Centurion University Skill Development trainingfor hearing and speechimpaired youths 60
6 MT Goonj Medical Support for Missed-Out Communities (Leprosy,Trans-genders, HIV patientsetc.) 2000
7 MT IDL Education Continuity Supportfor Visually Impaired Children 50
8 MT BMST Thalassemia disabled people –blood transfusions support 50
9 MT Bal Bhavan Disabled Friendly Park 0
10 MT Mindtree - NCPEDP Helen KellerAwards None 15
11 MT SSK Literacy Enhancement 280
12 MT Gubbachi Transform FoundationalLearning 90
13 MT Dream to Reality (D2R) None 22
14 MT Agastya Home Lab Kit 8000
15 MT Sikshana Foundation Sikshana @ Home 141966
16 MT BRDO Yuva Jyoti 957
17 MT Goonj Not Just Piece of Cloth(NJPC) 2500
18 MT Mindtree - OxyBus None 107
19 MT SankalpTaru MyTree Mindtree 5000
20 MT Olympics Gold Quest Paralympics Support 10
21 MT National Agro Foundation Integrated WatershedCommunity Development Program(IWCDP) 2001


Beneficiaries

Infosys and HCL, each provided total beneficiaries count. MindTree provided beneficiaries count per project. So I added all the beneficiaries to arrive at a total beneficiaries count. Interestingly beneficiaries count is not available in PDF report of HCL.

Beneficiaries Bar Chart

A bar chart showing number of beneficiaries of Corporate Social Responsibility programs of 3 leading Indian IT companies
Number of beneficiaries by company

Aspirational Districts


About Aspirational Districts

Launched in January 2018, the Aspirational Districts Programme (ADP) aims to quickly and effectively transform 112 most under-developed districts across India. The progress is measured across 49 Key Performance Indicators (KPIs) under 5 broad socio-economic themes - Health and Nutrition, Education, Agriculture and Water Resources, Financial Inclusion and Skill Development and Infrastructure. Please click NITI Ayog webpage to know more about the programme from the website of NITI Aayog.

Spend on Aspirational Districts - Data Table
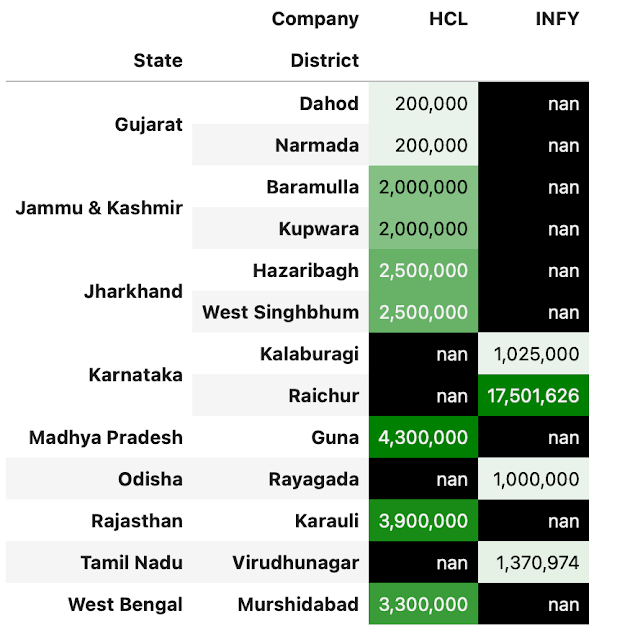
A table showing number of CSR beneficiaries by States and Districts in India
CSR spend in INR by states and districts in India

Aspirational Districts - Bar Chart of total spend

Please see the chart below.

A bar chart showing CSR spend in INR on aspirational districts in India - an important metric
CSR spend in INR on aspirational districts - an important metric for government of India

Aspirational Districts - Interactive Locations Map

Please click on the map link to see the interactive locations map.

The green markers represent locations of Infosys. Blue markers represent HCL locations. If you click a marker, you will see the name of the district.

Total spend on CSR projects

The information on total spend was not available.

Summary

The numerical CSR data that was pulled from BRR report in XML format was shown above and was very insightful. Textual information was also available to be read and captured.

Wednesday, February 1, 2023

Know your Plus Code [for NGOs] - locate your beneficiaries accurately

Monitor your social programmes - accurately

Introduction:


While Google Maps “Plus Codes” benefits all sections of a society and different types of businesses; this blog post is dedicated to NGOs. Further it focuses on NGOs working for beneficiaries living in congested areas.

(A) The Challenge:

How do you communicate addresses of beneficiaries of your programs living in congested areas when they do not have accurate formal addresses in the first place?

(B) The Solution:

Google Maps will now let India users rely on “Plus Codes“ when saving and sharing their home, office or project location addresses (digitally). These “Plus Codes“ do not depend on the street name, locality name, or town name. The code includes alphanumeric characters.

With a “Plus Code”, people can receive deliveries, access to emergency or social services, or just help each other find them.

“Plus Codes” are based on latitude and longitude. They use a simple grid system and a set of 20 alphanumeric characters. The character list purposely excludes easy to confuse characters like “1” or “l.”

Here’s an example of a Plus Code: JJXX+HR8, Seattle as given by Google.

This code can be generated, shared and searched by anyone -- all that’s needed is Google Maps on a smartphone. 


Here is another Indian example.

Please type “3275+72 Navi Mumbai, Maharashtra” and you will get the location of an NGO that I have worked with.


Google Plus Code Example


For knowing more on Plus Code please see the video.

Learn about Google Plus Codes.

(C) How to generate your Plus Code?

It is best explained by Google. Kindly click the google web page.

(D) The benefit:

Plus codes are very easy to use and share, a part of open source, work online or off-line and language independent. They do not include easily confused characters, are not case sensitive and they exclude vowels.

(E) Case study one:

Shelter Associates based in Pune are doing great work in this area. They map the slum data using GIS software and Google Earth. You can read a case study of what they have done for a youth living with his mother in Laxmi Nagar, a slum in the Western Indian city of Pune in a cramped one-room home with tin sheet walls and no address.


Please read the “the address of the future” case study.

To know the entire process, please see the youtube video. This project was implemented in Kolhapur, Maharashtra by Shelter Associates.

Transition to Actual Plus Code Name Plate

Household with Google plus code for precise location
How to display your Google Plus Code


(F) Case study two:

Please click here to know how addressing the unaddressed was made possible in Kolkata.

(G) Conclusion

I urge you to use “Plus Code'' technology to implement your projects in congested areas. Your projects may cover education, health care, sanitation, emergency services in case of a disaster or natural calamity.
The benefits include transparency, scalability, serving the unaddressed effectively with accuracy.


You may want to speak to Ms Smita Kale of Shelter Associates based in Pune to know more about the work they are doing on +912024440363 or email them on Info@shelter-associates.org


(H) Another technology another benefit

I have written another post explaining another benefit of using Google technology for social sector by NGOs. Please do read it.


Friday, January 20, 2023

3 additional benefits of listing your NGO on Google My Business

3 additional benefits of listing your NGO on Google My Business

Please refer to me earlier blog post. In that post, I covered four key benefits of listing your NGO on Google My Business. In this blog post, I am covering additional three benefits.

Upload new photos & videos regularly: Photos draw attention, and we like photos. Upload new photos regularly. 

Kindly think of the following while taking the photos - lighting, angle, device and backdrop. 

Further, also consider what are you emphasising on - activity, brand, team members, stakeholders. While taking photos capture the GPS location which is helpful.


Answer questions regularly (Q&A): Every Google My Business page has a questions and answers section. 

Anyone can ask a question on any topic. Ask your own questions, that your stakeholders might want to ask or have been asking you on phone or during personal interactions. 


Please answer those questions and provide additional information, as needed. These questions would give you an insight on what stakeholders are thinking. Engage with your stakeholders using Q&A. 


Kindly see below a screenshot of a Q&A section picked up from internet for an NGO.


Google My Business Question and Answer Screen Shot


Post regularly: Posts appear on the knowledge panel, which is on the right hand side of the search results.


These are critical. These are basically of following types - updates, events, and offers. 


Any update is  like any social media update having a photo and its brief description. You have to be really innovative to leverage this feature. Events are straightforward. Take a photo of the event and post it like a social media feed. 


Offers may not be relevant for you so we'll not talk about it.


Conclusion: Please set monthly goals.


Please set monthly goals for photos to be uploaded, questions to be answered, reviews to be replied, post to be added to drive engagement with your stakeholders using Google My Business (now called Google Business Profile). And Google search engine will take a positive note of the above efforts.


Tuesday, January 10, 2023

4 key benefits of listing your NGO on Google My Business

 4 key benefits of listing your NGO on Google My Business

The 4 key benefits

If you're not listed on Google My Business (GMB) already, here are the four key benefits of the listing on Google My Business (GMB). Google My Business is now called Google Business Profile. 


4 key Benefits of listing your NGO on Google My Business


The online listing is beneficial, especially for small NGOs that have a physical location around which they do their social activities. A community centre for example. For the URL for GMB is click on GMB website.

1. Visibility: This is useful specifically for small NGOs that need visibility.

After listing on Google My Business and when your NGO is searched online;  Google will display your NGO on Google Search and Google Maps. Your NGO will be listed at the top of search results. 
Further, if someone is searching for a local NGO, without specifying any name, on Google search or on Google maps; there is a good chance that your NGO will show up as local listing.

2. Your Telephone number: Your NGO can be called from search results from a mobile phone without the trouble of finding your telephone number from your website and then typing the number and calling.

More than 50% of on-line searches happen on mobile phones. After listing on Google My Business and searching for your NGO; the mobile search results page, provides a button to call ( call to action ) your NGO. Phone calls are thus facilitated by Google. Your NGO is just a phone call away!

3. Directions. Location of your NGO will be shown on the Google map once your name is displayed on the search result. 

This allows the interested person in finding your exact location, or reaching to your location. 

4. Reviews: This is a great way to engage with your audience.

This is another great feature that allows you to interact and engage with on-line visitors and look at their review comments and respond appropriately.

There are other benefits as well, such as uploading photos, linking to your social accounts and your website.


Once you set out to create your profile on Google My Business; you will be creating your profile on Google My Business in five easy steps. This will not take more than five minutes. 


But you need to have a Google account for going ahead with this registration. If you do not have one, you may want to create a Google account. 


Google will then validate your online account either by posting a letter to your physical address or through a phone call or an email. That’s it.


The next part of the process is, managing and optimising your profile. This can be done later. I will cover that in my next post. 


Sunday, December 18, 2022

Why should you register with NGO-Darpan?

The benefits of registration with NGO-Darpan for Voluntary Organisations (VOs) and Non-Governmental Organizations (NGOs)

About Ngo-Darpan

NGO-DARPAN is a platform that provides an interface between Voluntary Organisations (VOs) / Non-Governmental Organizations (NGOs) and key Government Ministries / Departments / Government Bodies. Later it is proposed to cover all Central Ministries / Departments / Government Bodies.


NITI Aayog invites all VOs / NGOs to sign up on the Darpan Portal. VOs / NGOs play a major role in the development of the nation by supplementing the efforts of the government. 


This NGO-DARPAN portal enables VOs / NGOs to enroll centrally and thus facilitates creation of a repository of information about VOs / NGOs, Sector/State wise. The Portal facilitates VOs / NGOs to obtain a system generated Unique ID, as and when signed. 


The Unique ID is mandatory to apply for grants under various schemes of Ministries/Departments/Governments Bodies.


Currently more than 1,50,000 NGOs are registered with Darpan. More than 50 government departments are participating in it.

Benefits of signing up with NGO-DARPAN

  • Completing the NGO Darpan Registration online can help NGOs receive timely and essential updates regarding government grants and other benefits. 
  • The portal provides basic information on the NGO. Further NGO database can be searched.
  • By obtaining a unique ID the credibility and trustworthiness of an NGO improves when seeking funds from trusts and corporate bodies. This unique online identity is useful specifically for small NGOs in getting visibility. 
  • NGOs can present the Darpan Identification Number if they seek FCRA registration for getting foreign funding, though it is made optional now. 

Wednesday, June 1, 2022

CSR-Dashboard

The Benefits of Digital Dashboards for Corporate Social Responsibility

Updated on

Introduction

Corporate Social Responsibility (CSR) is a self-regulating business model that helps a company be socially accountable. In this digital age, dashboards have become a significant tool in managing CSR activities effectively. Let's delve into the benefits of digital dashboards for CSR.

Real-Time Data

Digital dashboards provide real-time updates and insights, enabling companies to make immediate decisions based on current data. This is particularly useful in CSR initiatives where timely response is crucial.

Improved Transparency

With digital dashboards, companies can share their CSR progress with stakeholders and the public in a transparent manner. This can enhance the company's reputation and build trust among its stakeholders.

Efficient Resource Allocation

Digital dashboards allow companies to see which CSR initiatives are performing well. This can help them allocate resources more efficiently, ensuring that their CSR efforts have the greatest impact.

Let's begin:

I have developed a very simple and easy to understand spend dashboard for corporate social responsibility. it is intended for senior CSR executives such as CSR committee members.


How is this dashboard organised?

On the left hand side, you have the KPIs. and on the right hand side, you have the respective spend shown in percentage of the total. In KPIs, you have the yearly spend, spend by domain (such as education), spend by location ( e.g. state), spent by NGO. It quickly gives a bird eye view of the spend. By choice, it's a static dashboard. It can be updated and customised as often as required. It can be put in conference room, in the reception area for communicating the progress of CSR spend.


Reading the dashboard:

Let's say you want to know the spend on Domain – health. It is shown as 27% as a numeral as well as a corresponding darkened arc in a circle. The arc starts from equivalent position of 9 o'clock on the clock face. Any progresses clock wise. Showing the data in percentages of the total, helps in getting a grasp of the size of the proportion. Let's take another example. We want to know the spend on the top NGO as a percentage of the total. It is shown as 35%. This will help you take an executive decision such as reducing the spend on the top NGO.


How is this dashboard made?

It is drawn using 100% Visual Basic For Applications (VBA). It is customisable in so many different ways. Sustainable Development Goals (SDGs) can also be linked. Similarly you can add photos, logos, other art clippings. 

The concept can be extended to cover other functions namely Sustainability, Marketing, Social Media, Sales, Admin. And many more.

It is not using chars from excel and pasting it in Dashboard. It uses native shape objects of PowerPoint. 

But it uses excel for data and necessary calculations. The VBA code resides in Excel. You may put your actual data. Such static visualisations have great impact in corporate conference room discussions. 


Conclusion

Digital dashboards offer numerous benefits for managing CSR initiatives. By providing real-time data, improving transparency, and aiding in resource allocation, they can help companies make a significant social impact.


Hope you like it. Please do give your suggestions. 

CSR dashboard showing KPIs and the associated progress using circular arcs and percentages


Monday, May 23, 2022

Organising Data in Spreadsheets

Organising data in spreadsheets

The guide is designed so that you may down load it and keep it handy with you for a reference.

For a detailed explanation, please click the blog post.

The below guide explains how to organise data in spreadsheets.

Infographics to download


Monday, November 1, 2021

Data Organisation in spreadsheets : Part-III

Data Organisation in spreadsheets part III

Further to my earlier post, here is the last post on the topic.

-Make it a Rectangle

The best layout for your data within a spreadsheet is as a single big rectangle with rows corresponding to subjects and columns corresponding to variables.


The first row should contain variable names, and please do not use more than one rows for the variable names.


-Create a Data Dictionary 

It is helpful to have a separate file that explains what all of the variables are. It is helpful if this is laid out in rectangular form, so that the data analyst can make use of it in analyses.


Such a “data dictionary” might contain:

  • The exact variable name as in the data file
  • A version of the variable name that might be used in data visualizations
  • A longer explanation of what the variable means
  • The measurement units
  • Expected minimum and maximum values

-No Calculations in the Raw Data Files

Your primary data file should contain just the data and nothing else: no calculations, no graphs.


-Do Not Use Font Color or Highlighting as Data

As the logic will not be clear to the person analyzing the data. Instead add a column to comment on the value.


-Make Back ups

Make regular back ups in different locations.


-Use Data Validation to Avoid Errors

It might seem cumbersome but it will help you avoid data entry mistakes.

It would be worth it.


-Save the data in Plain Text Files

Keep the copy of your data files in a plain text format, with comma or tab delimiters.


- courtesy


Data Organization in Spreadsheets


Karl W. Broman & Kara H. Woo


Saturday, October 30, 2021

Organising data in Spreadsheets : Part-II

Data Organization in Spreadsheets (Part-II)

Continuing with my earlier blog with the below link; I am adding a few more points in this new blog.

- Choose Good Names for Things.


It is important to pick good names for things. This can be hard, and so it is worth putting some time and thought into it. 

As a general rule, do not use spaces, either in variable names or file names. They make programming harder: the analyst will need to surround everything in double quotes, like ”Health Care”, rather than just writing Health_Care. Where you might use spaces, use underscores or perhaps hyphens - pick one and be consistent. 

Avoid special characters, except for underscores and hyphens. Other symbols ($, @, %, #, &, *, (, ), !, /, etc.) often have special meaning in programming languages, and so they can be harder to handle. They are also a bit harder to type. 

- Choose Good Names for Things.


The main principle in choosing names, whether for variables or for file names, is short, but meaningful. So not too short. Finally, never include “final” in a file name. You will invariably end up with “final_ver2.” 

- Write Dates as YYYY-MM-DD.


When entering dates, please consider using the global “ISO 8601” standard, YYYY-MM-DD, such as 2013-02-27. Or be consistent with the date format for your region. 

- No Empty Cells Fill in all cells. 


Use some common code to fill missing data. 

- Put Just One Thing in a Cell.


The cells in your spreadsheet should each contain one piece of data. Do not put more than one thing in a cell. For example do not write employee name and ID in one cell. 

- Put Just One Thing in a Cell.

Finally, do not merge cells

It might look pretty, but you end up breaking the rule of no empty cells. Also it is not clear how to divide the number in the merged cell in to its constituent cells.

Further reading: For the third part and final part refer to the link given below.


Tuesday, October 26, 2021

Organizing data in Spreadsheets : Part-I

 Data Organisation in Spreadsheets (Part-I)

1. About Spreadsheets in general 

  • Congratulations on joining this journey of making better spreadsheets.
  • Spreadsheet is easy to use and that creates its own challenges.
  • Is the Spreadsheet formatted for Human Eyes?
  • Is the Spreadsheet formatted for a Computer? 
  • Is the Spreadsheet formatted for Both?

2. The answer is - Be Consistent…

-The first rule of data organization is be consistent. 

  • Whatever you do, do it consistently. Entering and organizing your data in a consistent way from the start will prevent you and your collaborators from having to spend time harmonizing the data later.
  • Use consistent codes for categorical variables. For a categorical variable like the mode of transport in a study of daily office commuters, use a single common value for private transport (e.g., “private”), and a single common value for public transport (e.g., “public”).

-Use a consistent fixed code for any missing values. 

  • Please have every cell filled in, so that one can distinguish between truly missing values and unintentionally missing values.
  • You could also use a hyphen.

-Use consistent variable names. 

  • If in one file (e.g., the first batch of subjects), you have a variable called “Public_Travel,” then call it exactly that in other files.

-Use a consistent data layout in multiple files. 

  • If your data are in multiple files and you use different layouts in different files, it will be extra work for the analyst to combine the files into one dataset for analysis.
  • With a consistent structure, it will be easy to automate this process.

-Use consistent file names. 

  • Have some system for naming files. If one file is called “Travel_batch1_2021-01-31.csv,” then do not call the file for the next batch “Travel2.csv” but rather use “Travel_batch2_2021-02-28.csv.
  • Keeping a consistent file naming scheme will help ensure that your files remain well organized, and it will make it easier to batch process the files if you need to.

-Use a consistent format for all dates, 

  • A format could be YYYY-MM-DD, for example, 2015-08-01. Or follow your local way of formatting dates.
  • If sometimes you write 8/1/2015 and sometimes 8-1-15, it will be more difficult to use the dates in analyses or data visualizations.

-Use consistent phrases in your notes. 

  • If you have a separate column of notes (e.g., “Personal Car” or “Bus”), be consistent in what you write. Do not sometimes write “Personal Car” and sometimes “Personal car,” or sometimes “Local Train” and sometimes “Local” or “Train”.

-Be careful about extra spaces within cells. 

  • A blank cell is different than a cell that contains a single space. And “Train” is different from “ Train ” (i.e., with spaces at the beginning and end). Similarly " Train" or "Train ". It has a space at the beginning and end respectively.

3. Further reading:

The links for the other two parts of this post.


Part-II


Part II post.


Part-III


Part III post.

Friday, September 3, 2021

A quick way of CSR Reporting II Using Excel SUMPRODUCT

Example of SUMPRODUCT function in Excel used for an example from Social Sector. 


Continuing from my previous blog post. I have added a date column. 

Now your manager wants to know the spend on covid relief related activities for January to March of 2021.

You could easily answer the question using SUMPRODUCT function. The expression will look like =SUMPRODUCT(Table1[Amount]*--(Table1[Date]<DATE(2021,4,1))*--(Table1[Date]>DATE(2020,12,31))*--(ISNUMBER((SEARCH("covid",Table1[Purpose],1)))))

The answer is Rs 4,25,000.

I had converted the range in to Excel Table before using it.  

To check if your answer is correct, filter the Date and Purpose column as shown below. Our answer matches and it is correct.

10:59 03-09-2021


Thursday, September 2, 2021

CSR Reporting I Using Excel SUMPRODUCT

Example of SUMPRODUCT function in Excel used for an example from Social Sector. 

Let us assume, that as a funding company your donations for a month are as per the table given below. 

Amount in Rupees

Description

25,000 

Covid Relief - PPE kits

10,000 

Covid Relief - Grocery kit 

40,000 

Covid Relief - Grocery kit 

20,000 

General Donation for healthcare activities

44,000 

Medical Assistance 

3,50,000 

Covid relief activities

10,000 

General donation 

6,000 

Monthly aid

89,600 

50% advance for supply of medicines

5,00,000 

Covid relief activities

4,980 

Supply of groceries to tribal children

5,00,000 

Relief activities for Covid

49,450 

Scholarship

22,166 

Scholarship


Your manager wants to know the spend on covid relief related activities for that particular month.

Now let us find out how SUMPRODUCT function can do the conditional sum. The Excel SUMPRODUCT function multiplies ranges or arrays together and returns the sum of products.

The expression to use is =SUMPRODUCT(Table1[Amount]*--(ISNUMBER((SEARCH("covid",Table1[Purpose],1))))). Where the dataset has a name of Table1.

If the term covid is found, the search function returns a number indicating its position. ISNUMBER function then would return True. The double negative forces True and False to 1 and 0 for doing the multiplication. Then the addition. 

=SUMPRODUCT(Table1[Amount]*(ISNUMBER((SEARCH("COVID",Table1[Purpose],1))))) is similar to the above formula. 

Thus, to recap, wherever the word covid is found, the function returns “True”, and the corresponding amount is multiplied by 1. All such amounts are added. The search term “covid” is not case sensitive. You can use “COVID” as well. The answer is Rs 14,25,000. 

Similarly formula =SUMPRODUCT(Table1[Amount]*--(ISNUMBER((SEARCH("Scholarship",Table1[Purpose],1))))) can be used to calculate donations given as Scholarships. The answer is Rs 71,616.

In my next blog, I will add another dimension of time to calculate the conditional sum.

13:26 01-09-2021

***

Thursday, March 12, 2020

multi-index (column) report using pandas

multi-index-09-03-2020 <!-- Custom stylesheet, it must be in the same directory as the html file
In [1]:
import pandas as pd
import numpy as np


#1 input file
input_file = r"D:\Python Scripts\multi_index_3.xlsx"

df1=pd.read_excel(input_file)
df1['Focus_area']=df1['Focus_area'].astype('category')
table0=df1
table0
#table0 is shown below.
Out[1]:
Focus_area City As_on Spend
0 Education Mumbai 2019-01-01 1000000
1 Healthcare Pune 2019-03-31 20000
2 Environment Chennai 2018-03-31 100000
3 Disaster Relief Bengaluru 2017-12-01 220000
4 Vocational Skills Varanasi 2018-09-30 540000
5 Education Pune 2019-06-30 3000000
6 Environment Pune 2019-03-31 666000
In [67]:
df1['As_on']=pd.to_datetime(df1.As_on)
In [68]:
df1.dtypes
Out[68]:
Focus_area          category
City                  object
As_on         datetime64[ns]
Spend                  int64
dtype: object
In [69]:
df1 = df1.set_index(['Focus_area','City'])
In [70]:
df1.dtypes
Out[70]:
As_on    datetime64[ns]
Spend             int64
dtype: object
In [4]:
df1.groupby(df1['As_on'])['Spend'].sum()
Out[4]:
As_on
2017-12-01     220000
2018-03-31     100000
2018-09-30     540000
2019-01-01    1000000
2019-03-31     686000
2019-06-30    3000000
Name: Spend, dtype: int64
In [5]:
df1['Quarter'] = pd.PeriodIndex(df1['As_on'], freq='Q-MAR').strftime('Q%q')#Adding quarter to the dataframe.

Q-DEC specifies quarterly periods whose last quarter ends on the last day in December.

Q-MAR specifies quarterly periods whose last quarter ends on the last day in March.

In [ ]:
df1
In [7]:
df1['Year']=df1.As_on.dt.year#Adding Year to the dataframe.
df1
Out[7]:
Focus_area City As_on Spend Quarter Year
0 Education Mumbai 2019-01-01 1000000 Q4 2019
1 Healthcare Pune 2019-03-31 20000 Q4 2019
2 Environment Chennai 2018-03-31 100000 Q4 2018
3 Disaster Relief Bengaluru 2017-12-01 220000 Q3 2017
4 Vocational Skills Varanasi 2018-09-30 540000 Q2 2018
5 Education Pune 2019-06-30 3000000 Q1 2019
6 Environment Pune 2019-03-31 666000 Q4 2019
In [12]:
df2 = pd.pivot_table(df1,index=['City','Focus_area'],columns=['Year','Quarter'],values=['Spend'],fill_value=0)#works
#df2.query('City==["Pune","Mumbai"]')#works
In [13]:
df2
Out[13]:
Spend
Year 2017 2018 2019
Quarter Q3 Q2 Q4 Q1 Q4
City Focus_area
Bengaluru Disaster Relief 220000 0 0 0 0
Chennai Environment 0 0 100000 0 0
Mumbai Education 0 0 0 0 1000000
Pune Education 0 0 0 3000000 0
Environment 0 0 0 0 666000
Healthcare 0 0 0 0 20000
Varanasi Vocational Skills 0 540000 0 0 0
In [14]:
df2 = pd.pivot_table(df1,index=['Year','Quarter'],columns=['City','Focus_area'],values=['Spend'],fill_value=0)#works
df2
Out[14]:
Spend
City Bengaluru Chennai Mumbai Pune Varanasi
Focus_area Disaster Relief Environment Education Education Environment Healthcare Vocational Skills
Year Quarter
2017 Q3 220000 0 0 0 0 0 0
2018 Q2 0 0 0 0 0 0 540000
Q4 0 100000 0 0 0 0 0
2019 Q1 0 0 0 3000000 0 0 0
Q4 0 0 1000000 0 666000 20000 0
In [ ]:
df2.stack(level=0)#works
#level=0 is the outermost level i.e. spend
#level=1 is the next level i.e. city
#level=2 is the innermost level i.e. Focus_area
In [22]:
df2.unstack(level=1)
#level=0 is the outermost level i.e. Year
#level=1 is the next level i.e. quarter
Out[22]:
Spend
City Bengaluru Chennai Mumbai ... Pune Varanasi
Focus_area Disaster Relief Environment Education ... Environment Healthcare Vocational Skills
Quarter Q1 Q2 Q3 Q4 Q1 Q2 Q3 Q4 Q1 Q2 ... Q3 Q4 Q1 Q2 Q3 Q4 Q1 Q2 Q3 Q4
Year
2017 NaN NaN 220000.0 NaN NaN NaN 0.0 NaN NaN NaN ... 0.0 NaN NaN NaN 0.0 NaN NaN NaN 0.0 NaN
2018 NaN 0.0 NaN 0.0 NaN 0.0 NaN 100000.0 NaN 0.0 ... NaN 0.0 NaN 0.0 NaN 0.0 NaN 540000.0 NaN 0.0
2019 0.0 NaN NaN 0.0 0.0 NaN NaN 0.0 0.0 NaN ... NaN 666000.0 0.0 NaN NaN 20000.0 0.0 NaN NaN 0.0
3 rows × 28 columns
In [ ]:
 
-->