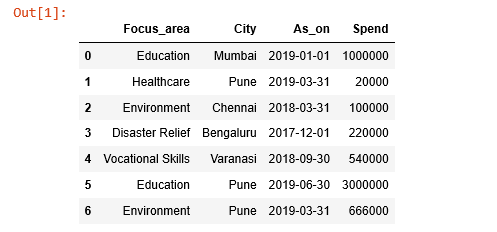
I wanted to make a report with multi-index columns and rows using python and pandas.
The starting point was data in Excel file. The data was brought in pandas data frame.
I wanted an output report that looked like the report shown below.
But there was one condition. The condition was the quarters of the year has to be as per Indian financial year that starts on 1st April and end on 31st March the following year.
What helped me was the below syntax.
Q-DEC specifies quarterly periods whose last quarter ends on the last day in December.
Q-MAR specifies quarterly periods whose last quarter ends on the last day in March.
So, I chose Q-MAR.
The data shown is about spend on Social and Environmental efforts of a company in India. A similar report has to be published by the company, as applicable, as per Indian laws.
The report format can also be extended to report on financial numbers. The data itself is imaginary.


No comments:
Post a Comment