Saturday, July 25, 2020

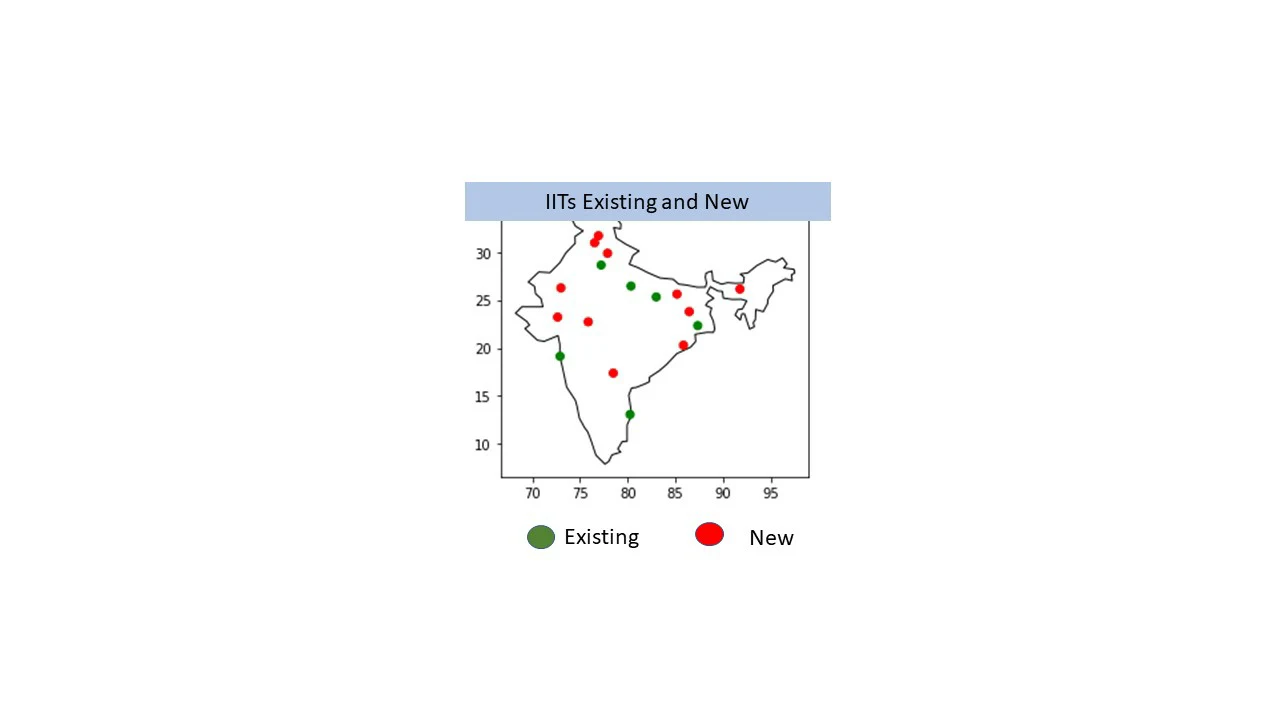
Where are IITs located?

With new Indian Institues of Technology (IITs) set up; I was keen to know their locations. 

Here is plot that shows their locations. 

I created the dataset. Using pandas and geopands I plotted this figure. 

It was good learning. I could set their colors differently as I wanted. 

This was intended but the map shows an interesting pattern. Most of the IITs are in Northern India. 

Tuesday, July 21, 2020

plot showing population of Rajasthan India districtwise using geopandas

A geopandas chart showing population of Rajasthan India district wise
I had the shape file of state of Rajasthan in India. The next step was to create a  virtual environment for geo Pandas on my Anaconda distribution on windows laptop. 

I did that. 

Once I had the set up and data, I plotted the population of the state. Geo Pandas made it really easy to plot the geo data and associated properties. 

I am looking forward to working on more geo Pandas plots. 


Sunday, July 19, 2020

World population map with GeoPandas

World population map with GeoPandas


Today I had decided to plot my first plot using GeoPandas; and I am glad I could do it today.

Below is the plot of world-population. But the plot is not that important.

What is important is how I got to this point. After attaining some momentum with pandas almost six months ago; I could not do much with GeoPandas. The reason was when I downloaded GeoPandas; it also loaded it dependencies and disturbed by existing packages in Anaconda distribution on my Windows laptop. So I had to remove GeoPandas.

The solution, I understood, needed multiple separate environments. That is done by installing virtual environments. Here was where I lost the momentum.

The options to install virtual environments are many; and that needed me to understood what was relevant for me. Finally I figured that out today.

I opted to install the needed virtual environment using Anaconda GUI. I loaded the necessary packages. I was not clear what happens to the IDE. It also installed on its own.

I now hope to build on what I have learned today!


World population map with GeoPandas

Thursday, May 21, 2020

Ubuntu

The benefits of Ubuntu Linux distribution

I bought a new laptop with Ubuntu distribution in September of 2015. I had decided to learn good useful software packages available under it.  

I learned, from beginning, Python 2.7 on it in 2nd half of 2017. Then it was not used for a while. The reason is I bought Windows laptop to learn Python3. And use Excel. I added Power Query and Power BI to it.

Back to Ubuntu distribution. 

But I was determined to use my Ubuntu laptop. So during COVID-19 I started using the functionality available at command prompt. 

Soon I could do copying of files, moving files through simple commands at the prompt. 

I had lots of files, photos on internal drive, external drive, on media card and USB pen drives. I moved all my files in to designated folders. The software has a GUI like windows. But moving files using commands at the prompt is much easier. Also you could set some conditions such copy only newer or updated files. 

I had read about it, but now i experienced it. 

As a next step I learned to write shell scripts to do files management through shell scripts. 

The next part was learning the text processing ability of Linux. Text processing becomes easy with grep, sed, and awk. Regular Expressions is also one has to learn to use these three commands. 

With awk one could work on data with columns and rows and make analysis and prepare reports. 

Here also you could write scripts to automate these tasks. I could write scripts in shell for grep, sed, and awk.

I used pdfgrep to read pdf files. I downloaded pdfgrep. 

I had to learn how to download,  update my packages from central servers using command prompt. Learning to read help files is part of it. 

The power and flexibility of these commands is immense. 

The next stage is to use it for the real world applications. In fact I learned only to work on real world applications. 

I am happy with my progress so far and hope to put it to some good use. 

Friday, May 1, 2020

State-wise electricity consumption - India

State-wise electricity consumption - India
I had prepared this report almost a month ago. I am posting it today. It was part of my learning Power BI reports. The data was taken from wiki (internet).

Maharashtra has the highest consumption of electricity followed by Namil Nadu and Gujarat. It is followed by Karnataka and Central India (UP, MP and Rajasthan).

If electricity consumption is proxy to the the progress of a state then the chart clearly tells you the story.