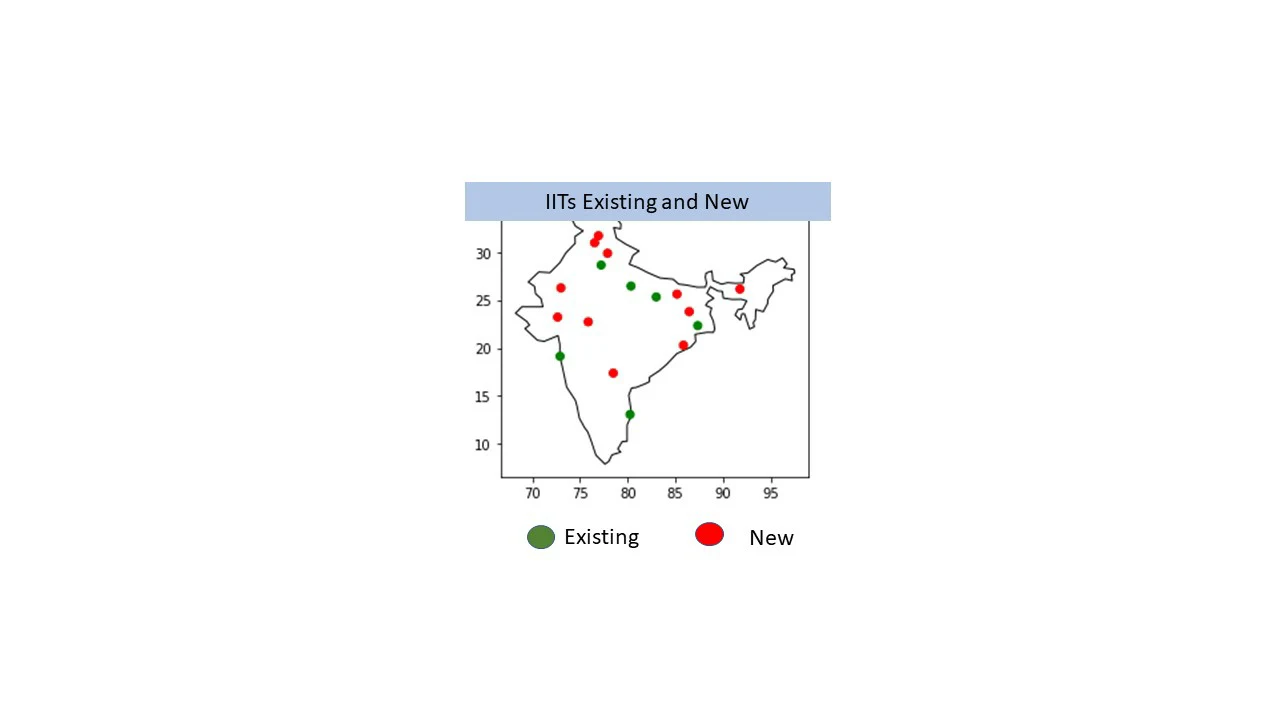
Saturday, July 25, 2020
Where are IITs located?
Tuesday, July 21, 2020
plot showing population of Rajasthan India districtwise using geopandas
 |
| A geopandas chart showing population of Rajasthan India district wise |
Sunday, July 19, 2020
World population map with GeoPandas
World population map with GeoPandas
Today I had decided to plot my first plot using GeoPandas; and I am glad I could do it today.
Below is the plot of world-population. But the plot is not that important.
What is important is how I got to this point. After attaining some momentum with pandas almost six months ago; I could not do much with GeoPandas. The reason was when I downloaded GeoPandas; it also loaded it dependencies and disturbed by existing packages in Anaconda distribution on my Windows laptop. So I had to remove GeoPandas.
The solution, I understood, needed multiple separate environments. That is done by installing virtual environments. Here was where I lost the momentum.
The options to install virtual environments are many; and that needed me to understood what was relevant for me. Finally I figured that out today.
I opted to install the needed virtual environment using Anaconda GUI. I loaded the necessary packages. I was not clear what happens to the IDE. It also installed on its own.
I now hope to build on what I have learned today!
 |
| World population map with GeoPandas |
Thursday, May 21, 2020
Ubuntu
The benefits of Ubuntu Linux distribution
Friday, May 1, 2020
State-wise electricity consumption - India
 |
| State-wise electricity consumption - India |
Maharashtra has the highest consumption of electricity followed by Namil Nadu and Gujarat. It is followed by Karnataka and Central India (UP, MP and Rajasthan).
If electricity consumption is proxy to the the progress of a state then the chart clearly tells you the story.
